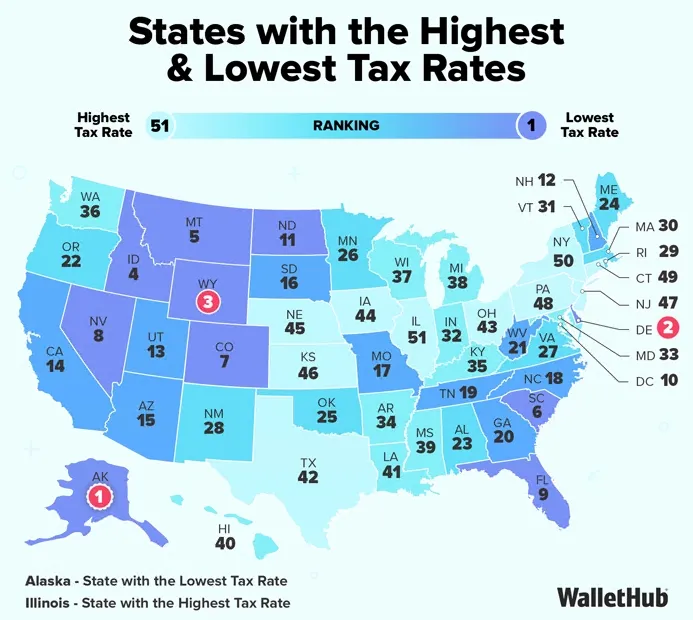
2026 年报税季临近,美国各州州税与地方税差异显著,税负最重州的负担可达最轻州两倍以上。WalletHub 发布 2026 年美国各州税负排行榜,综合所得税、房产税、销售与消费税等维度,对比全美 50 州及华盛顿特区的实际税负水平,清晰呈现税负高低分布,为居民与投资者提供参考税负最低前五州
阿拉斯加 | 6.94% | $5,634
特拉华 | 7.19% | $5,842
怀俄明 | 7.58% | $6,156
爱达荷 | 7.65% | $6,215
蒙大拿 | 7.88% | $6,398
税负最高前五州
伊利诺伊 | 16.87% | $13,699
纽约 | 14.95% | $12,143
康涅狄格 | 14.58% | $11,838
宾夕法尼亚 | 14.09% | $11,445
新泽西 | 14.06% | $11,416

对于数百万需要向美国政府缴税的美国人而言,报税季往往充满压力。美国家庭平均每年需缴纳近 14,000 美元的联邦所得税。尽管所有人都面临相同的联邦纳税义务,但各州及地方的税收差异却十分显著。例如,税负最重州的纳税人,其缴纳的税款是税负最轻州的两倍以上。
但令人意外的是,所得税税率低并不代表整体税负就低。举例来说,华盛顿州居民虽无需缴纳州所得税,却仍要将年收入的近 9% 用于支付销售税和消费税。得克萨斯州居民同样无需缴纳所得税,但其收入的 1.49% 要用于缴纳房产税,这一比例位居全美前列。
随着今年 4 月 15 日报税截止日临近,WalletHub 对比了美国 50 个州及华盛顿特区与全国中位数水平,梳理出纳税人缴税金额最少和最多的地区。我们将各州及地方的有效所得税率,套用于美国人均收入水平,以此计算出相对所得税负担。
Main Findings
EMBED ON YOUR WEBSITE
Taxes by State
Overall Rank(1=Lowest) | State | Effective Total State & Local Tax Rates on Median U.S. Household* | Annual State & Local Taxes on Median U.S. Household* | % Difference Between State & U.S. Avg.** | Annual State & Local Taxes on Median State Household*** | Adjusted Overall Rank (based on Cost of Living Index) |
|---|
| | | | | | |
| | | | | | |
| | | | | | |
| | | | | | |
| | | | | | |
| | | | | | |
| | | | | | |
| | | | | | |
| | | | | | |
| | | | | | |
| | | | | | |
| | | | | | |
| | | | | | |
| | | | | | |
| | | | | | |
| | | | | | |
| | | | | | |
| | | | | | |
| | | | | | |
| | | | | | |
| | | | | | |
| | | | | | |
| | | | | | |
| | | | | | |
| | | | | | |
| | | | | | |
| | | | | | |
| | | | | | |
| | | | | | |
| | | | | | |
| | | | | | |
| | | | | | |
| | | | | | |
| | | | | | |
| | | | | | |
| | | | | | |
| | | | | | |
| | | | | | |
| | | | | | |
| | | | | | |
| | | | | | |
| | | | | | |
| | | | | | |
| | | | | | |
| | | | | | |
| | | | | | |
| | | | | | |
| | | | | | |
| | | | | | |
| | | | | | |
| | | | | | |
*Assumes “Median U.S. Household” has an annual income of $81,211 (mean third quintile U.S. income); owns a home valued at $332,700 (median U.S. home value); owns a car valued at $29,100 (the highest-selling car of 2025); and spends annually an amount equal to the spending of a household earning the median U.S. income.**National Average of State and Local Tax Rates = 11.02%***Assumes “Median State Household” has an annual income equal to the mean third quintile income of the state; owns a home at a value equal to the median of the state; owns a car valued at $29,100 (the highest-selling car of 2025); and spends annually an amount equal to the spending of a household earning the median state income.
Gas Taxes (per gallon)
Lowest
1. Alaska
2. Hawaii
3. New Mexico
4. Arizona
T-5. Oklahoma
T-5. Texas
Highest
47. Indiana
48. Pennsylvania
49. Washington
50. Illinois
51. California
Best State vs. Worst State: 8x Difference
Alaska vs. California
State Cigarette Tax Rates* (per pack of 20 cigarettes)
Lowest
1. Missouri
2. Georgia
3. North Dakota
4. North Carolina
T-5. Idaho
T-5. South Carolina
Highest
Best State vs. Worst State: 31x Difference
Missouri vs. New York
Food Tax Rates
States with No Food Tax
T-1. Alaska
T-1. Arizona
T-1. California
T-1. Colorado
T-1. Connecticut
Worst
47. Louisiana
48. Missouri
49. Idaho
50. Tennessee
51. Mississippi
*Note: Local Taxes are not included and can be substantial.
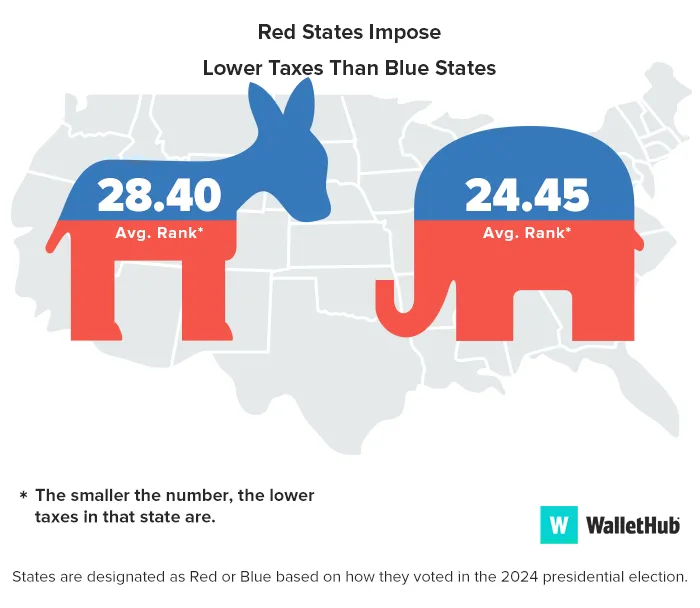
Blue vs. Red States
State & Local Tax Breakdown
All effective tax rates shown below were calculated as a percentage of the mean third quintile U.S. income of $81,211 and based on the characteristics of the Median U.S. Household*.
State | Effective Real-Estate Tax Rate | Real-Estate Tax Rank ($) | Effective Vehicle Property Tax Rate | Vehicle Property Tax Rank ($) | Effective Income Tax Rate | Income Tax Rank ($) | Effective Sales & Excise Tax Rate | Sales & Excise Tax Rank ($) | Effective Total State & Local Tax Rates on Median U.S. Household* |
|---|
| | | | | | | | | |
| | | | | | | | | |
| | | | | | | | | |
| | | | | | | | | |
| | | | | | | | | |
| | | | | | | | | |
| | | | | | | | | |
| | | | | | | | | |
| | | | | | | | | |
| | | | | | | | | |
| | | | | | | | | |
| | | | | | | | | |
| | | | | | | | | |
| | | | | | | | | |
| | | | | | | | | |
| | | | | | | | | |
| | | | | | | | | |
| | | | | | | | | |
| | | | | | | | | |
| | | | | | | | | |
| | | | | | | | | |
| | | | | | | | | |
| | | | | | | | | |
| | | | | | | | | |
| | | | | | | | | |
| | | | | | | | | |
| | | | | | | | | |
| | | | | | | | | |
| | | | | | | | | |
| | | | | | | | | |
| | | | | | | | | |
| | | | | | | | | |
| | | | | | | | | |
| | | | | | | | | |
| | | | | | | | | |
| | | | | | | | | |
| | | | | | | | | |
| | | | | | | | | |
| | | | | | | | | |
| | | | | | | | | |
| | | | | | | | | |
| | | | | | | | | |
| | | | | | | | | |
| | | | | | | | | |
| | | | | | | | | |
| | | | | | | | | |
| | | | | | | | | |
| | | | | | | | | |
| | | | | | | | | |
| | | | | | | | | |
| | | | | | | | | |
*Assumes “Median U.S. Household” has an income equal to $81,211 (mean third quintile U.S. income); owns a home valued at $332,700 (median U.S. home value); owns a car valued at $29,100 (the highest-selling car of 2025); and spends annually an amount equal to the spending of a household earning the median U.S. income.


如果您看完後,覺得此內容對您或您的朋友有幫助,請轉發至您的朋友群,或直接轉發給您的朋友和您加入的微信群,有了大家的支持,我們會更加努力!滅蟑螂,找靠譜哥(蟑光一號)保證藥到蟑光,可以紅包, 支付寶,支票,或PayPal 付款, 無效退款。 加微信:1171378803 訂購熱線: 9098953351